simX
Unofficial Mac Genius
OK, so I woke up today, and I heard the disk churning a lot, and so I turned on my computer -- a glance at the memory monitor showed that over half of my memory was active or wired, and that the rest of it was inactive, and not free (I have 896 MB of RAM, so that's a HUGE amount of active+wired memory). So I checked in top to see what might be using all that memory -- Norton, or something. Nothing out of the ordinary using so much RAM. So I quit all of my applications. Still my active+wired memory was over half of my total RAM. But something didn't seem right -- I went back to top to check on the memory usage, and it didn't seem like it added up. So I grabbed a calculator -- and added up all the columns of memory for RPRVT, RSHRD, and RSIZE in top. Now I knew that I would be adding up more memory than was actually being used, because RPRVT and RSHRD are included in RSIZE.
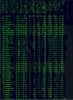
Well, so what did I find? Total, as reported by all the processes individually, including the kernel (process 0 -- I believe process 0 is the first process, so I did include every process), the memory that was being used was 197.9 MB. But total, the top command was reporting an obscene 532 MB active, 603.2 active+wired! I've included a screenshot of the terminal window (it has some text superimposed on it because I need to register Snapz Pro X, but you should be able to read it) so you guys can check my math. Remember, I added up all 3 columns of the top command, so the 200 MB is probably over the actual total by about 50-100 MB.
Clearly something is wrong here. Does anybody know what could be causing this? Every once in a while it seems like it does this to an extent, but it hasn't done it to this degree. As we speak, over half of my memory is being used as active or wired memory, but I can't figure out what!! And the numbers in top still do not add up.
Any information would be appreciated.
P.S. I have to run right now, but I know that the picture of the terminal window looks really gross. I'm going to put the picture on my iDisk when I get back -- my member name is "simX" -- just go to my public folder.
")