
I've conducted a little survey and would like to present my findings in form of one or several graphs or charts.
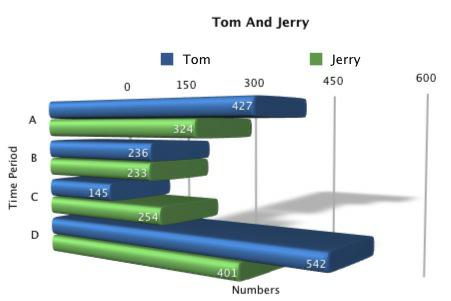
Instead of the usual bar and pie charts we've all seen a thousand times, is there any software which allows me to do this in a more stylish and different way, like in a "3D" type way?
It should be easy to use (I've never used Excel for instance) and preferably free or cheap.
Instead of the usual bar and pie charts we've all seen a thousand times, is there any software which allows me to do this in a more stylish and different way, like in a "3D" type way?
It should be easy to use (I've never used Excel for instance) and preferably free or cheap.